50% of Transjakarta's Revenue Comes from Just 5 Operational Hours! 🚌
We often view transportation data merely as statistics. However, for my Microsoft Excel Bootcamp Final Project with DQLab, I decided to dive deeper into a full month of Transjakarta transaction data to uncover the story behind the numbers.
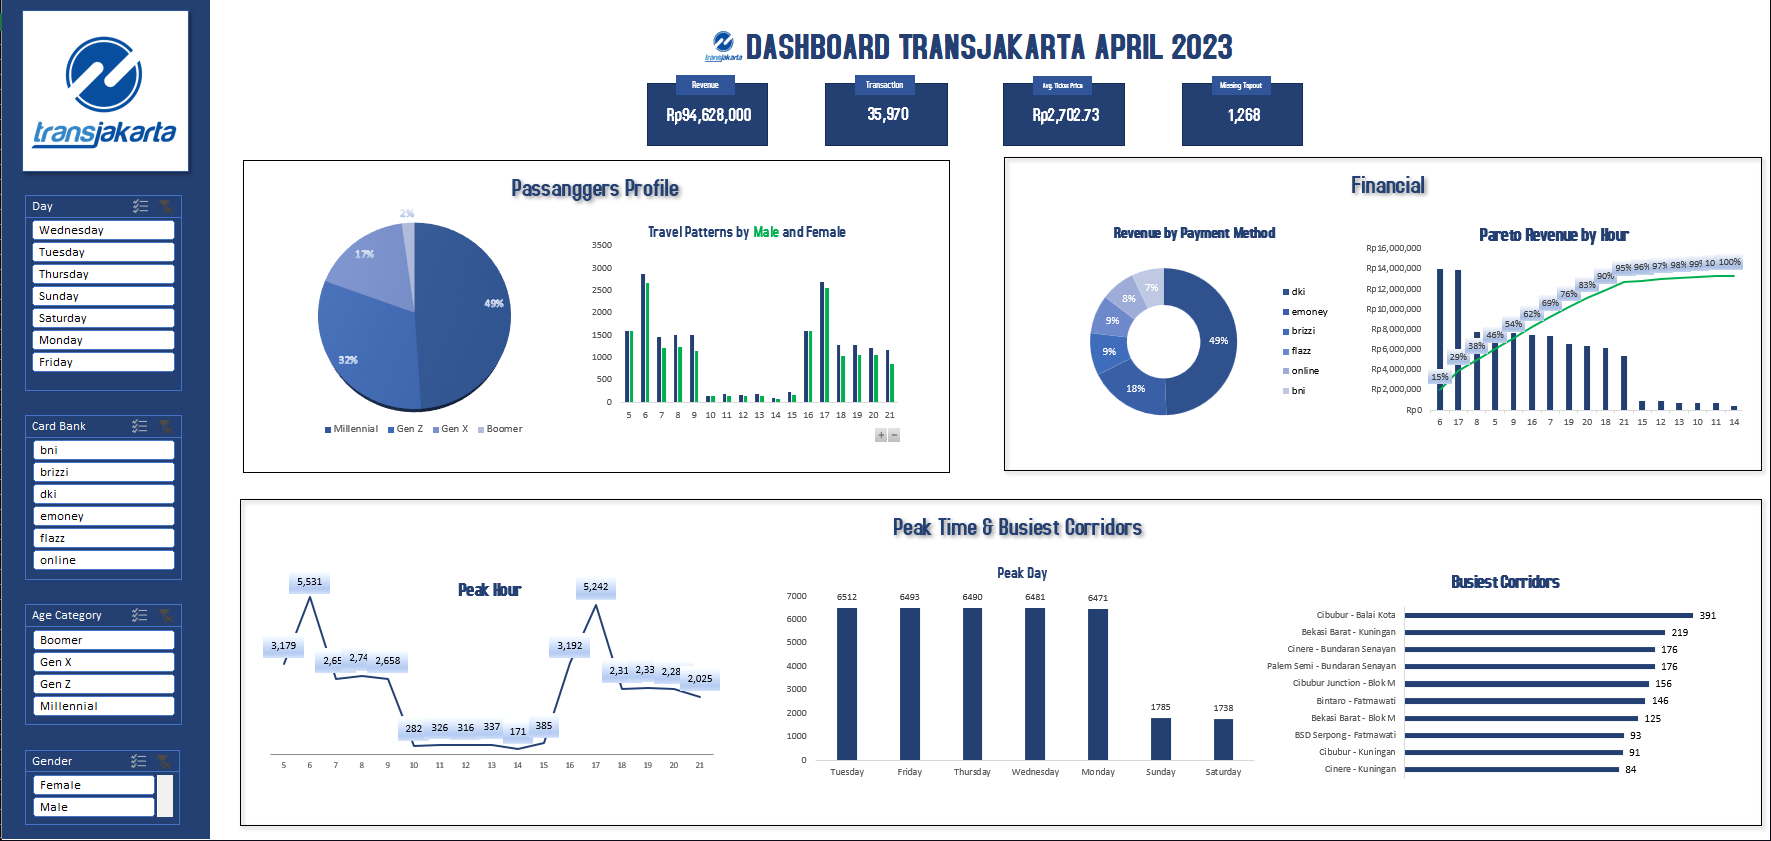
This project, titled "Navigating the Pulse of Jakarta," opened my eyes to the mobility patterns of our capital city. Here are some key insights from my Excel Dashboard:
The Golden 5 Hours: Pareto's Principle in action! 54% of daily revenue is generated between 05:00-09:00 AM and at 05:00 PM.
Weekend Cliff: A drastic 73% drop in passengers during weekends, indicating that Transjakarta remains a "Pure Commuter" mode of transport.
Gen-Z & Millennials Dominance: 80% of passengers are within the productive age group, demanding fully digital services.
Operational Gap: Between 10:00 AM – 02:00 PM, traffic drops by up to 97%, presenting a significant opportunity for fleet efficiency.
I managed this project end-to-end using Microsoft Excel, from Data Cleaning with Power Query and Data Modeling to creating an interactive Visualization Dashboard.
Data isn't just about what happened; it's about finding opportunities for the future.
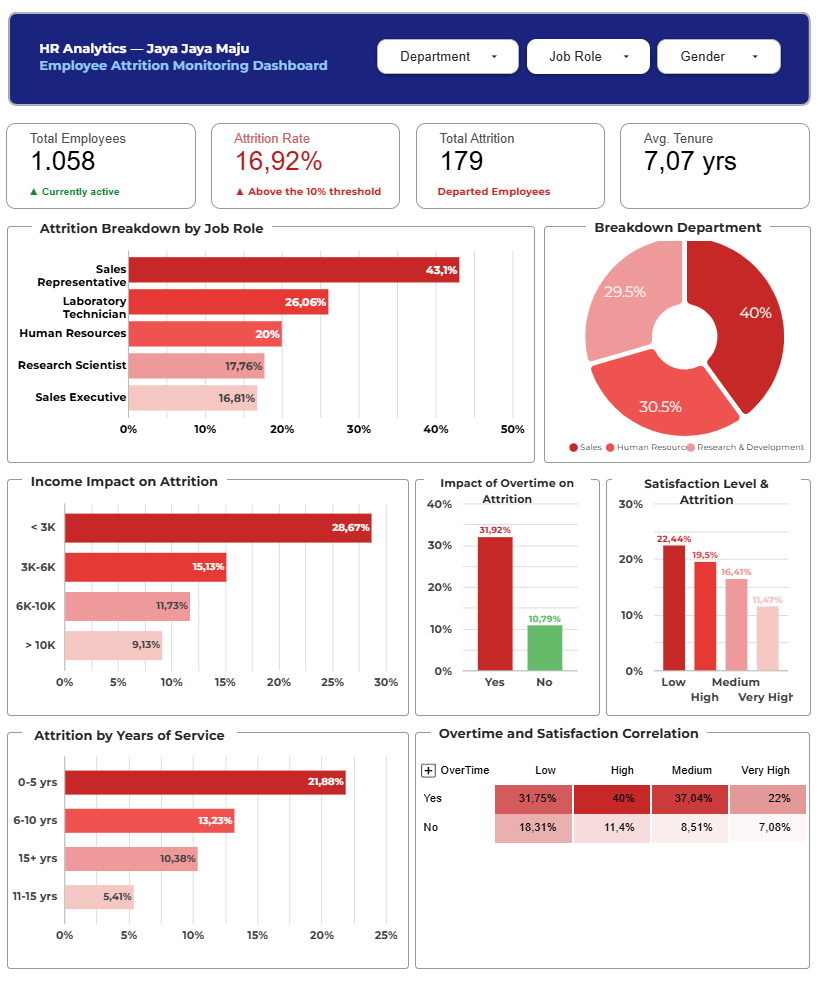
Jaya Jaya Maju is a multinational corporation established in 2000, with a workforce of over 1,000 employees spread across the country. Despite its significant scale, the company still faces challenges in managing its workforce. This has resulted in a high attrition rate—the ratio of staff departures relative to the total headcount—exceeding 10%.
The HR Department requires assistance in identifying the various factors driving this high turnover rate and seeks a business dashboard to monitor these factors on a continuous basis.
This end-to-end data analytics project focuses on diagnosing and understanding customer churn within the banking sector. With a churn rate of 20% across 10,000 customers, the bank faced a critical challenge: retaining financially stable, long-term clients who were actively moving their capital to competitors.
The analysis was conducted using the CRISP-DM (Cross-Industry Standard Process for Data Mining) methodology — moving beyond surface-level visualization into deep business understanding and strategic evaluation.
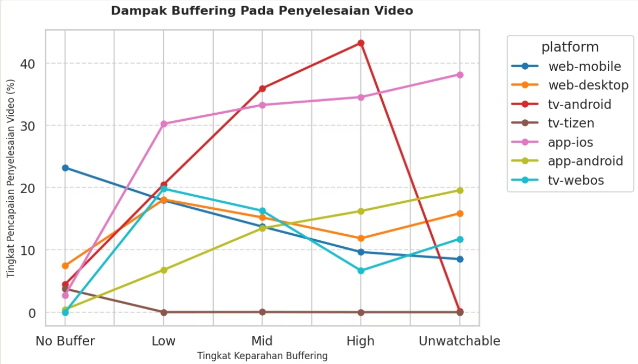
This project explores a massive-scale user interaction dataset (approx. 14GB) from a major Video-on-Demand (OTT) platform. The primary objective is to translate raw viewing logs into actionable business strategies across four key pillars: Marketing ROI, Technical User Experience (UX), Product Feature Effectiveness, and Content Monetization.
By processing millions of rows using highly memory-efficient techniques, this analysis provides clear, data-driven recommendations to optimize ad spend, reduce churn rate, and maximize platform loyalty.