Key Business Questions Solved
This analysis answers 5 critical business questions, detailed fully in the presentation deck:
Marketing ROI & Acquisition Quality: Which marketing campaigns bring in high-intent users (highest Quality View Rate) rather than just clickbait traffic?
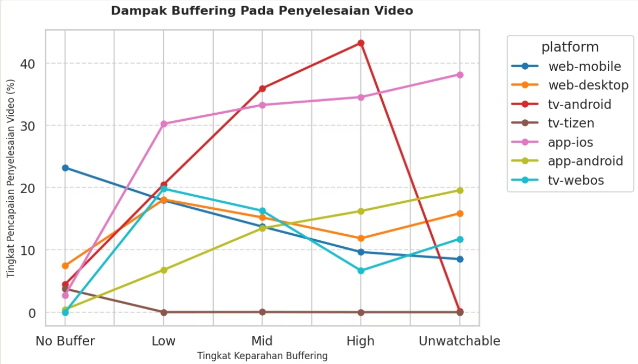
Technical UX & Churn Analysis (The Drop-off Cliff): What is the maximum tolerance for latency (buffering duration) before users abandon a video, and how does it impact the completion rate?
Product Feature Effectiveness: Does the Autoplay feature genuinely increase user engagement, or does it contribute to a higher Bounce Rate?
Content Monetization Strategy: In the Premium (Paid) segment, which mega-genres have the highest binge-watching (completion) rates compared to the Free segment?
Platform Loyalty (Core Audience): Across various ecosystems (Smart TV, Mobile App, Web-Mobile), where do the most loyal users reside based on the average watch duration?
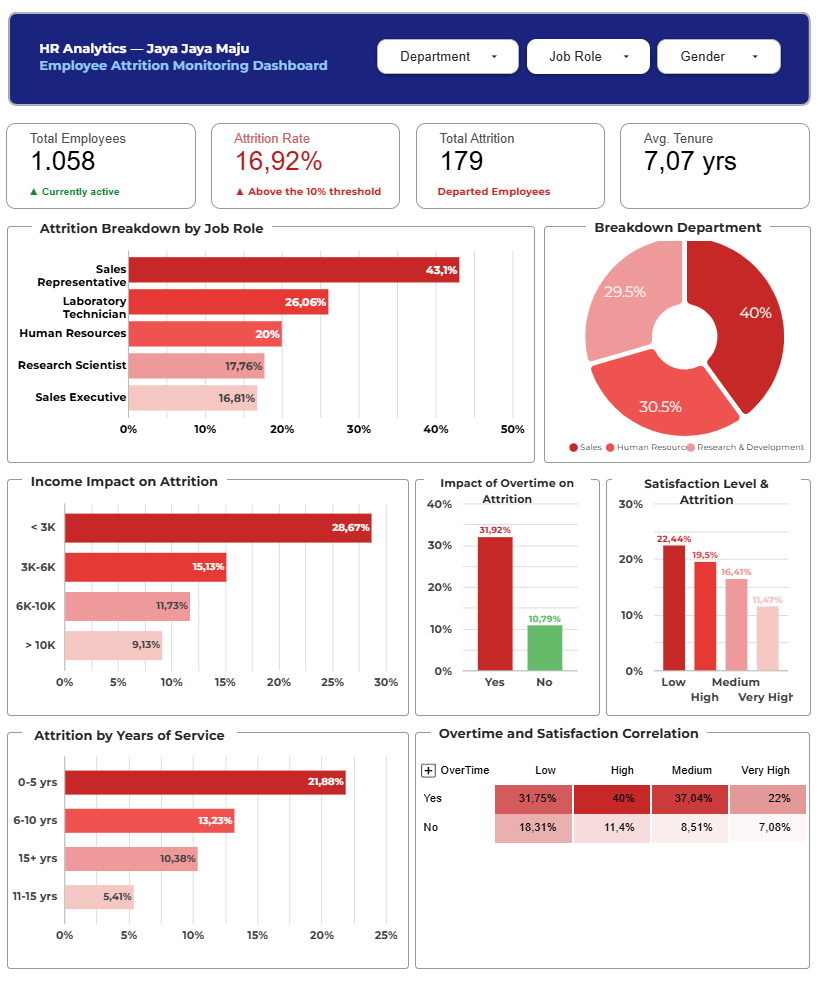
Jaya Jaya Maju is a multinational corporation established in 2000, with a workforce of over 1,000 employees spread across the country. Despite its significant scale, the company still faces challenges in managing its workforce. This has resulted in a high attrition rate—the ratio of staff departures relative to the total headcount—exceeding 10%.
The HR Department requires assistance in identifying the various factors driving this high turnover rate and seeks a business dashboard to monitor these factors on a continuous basis.
This end-to-end data analytics project focuses on diagnosing and understanding customer churn within the banking sector. With a churn rate of 20% across 10,000 customers, the bank faced a critical challenge: retaining financially stable, long-term clients who were actively moving their capital to competitors.
The analysis was conducted using the CRISP-DM (Cross-Industry Standard Process for Data Mining) methodology — moving beyond surface-level visualization into deep business understanding and strategic evaluation.
A comprehensive end-to-end data analysis project using Microsoft Power BI to diagnose business performance for Olist, a Brazilian e-commerce platform. This project analyzes over 100,000 transaction records to uncover the root causes of stagnant customer satisfaction scores. Key findings reveal critical bottlenecks in the logistics chain—specifically within carrier transit times—and highlight geographical disparities hindering market expansion. The dashboard provides actionable insights to optimize supply chain operations and improve customer experience.